Poultry farm league and alerts: first week to FCR
How PoultryOS turns the daily entries of every farm into a home screen, an owner dashboard, a farm league ranked by EPEF, FCR, mortality and cost, and alerts that reach the right person the same day.
 Sagar Godbole · Chief Product Officer, InfraBeat Technologies
An integrator does not lose money on one bad day. It loses money on a bad week at one farm that nobody looked at until the lifting bill came in. In contract broiler farming the farmer, the supervisor and the branch each hold a piece of that picture. PoultryOS, a poultry ERP built around the batch, puts the pieces together from the one place they all start: the daily entry made on the phone in the shed. The same entry feeds the home screen, the owner dashboard, the farm league and the alerts, so the farm that is slipping shows up the same evening.
This post walks through those views in the sample organisation, Shree Agro Integration, with the figures read from its screens.
The home screen: today across every farm
The owner opens the app and sees the whole operation before any single batch. The dark card holds the token balance, the active batches and the live birds. Under Today come four tiles: the entries still pending, the mortality of the day, the running FCR against the standard and the average age.
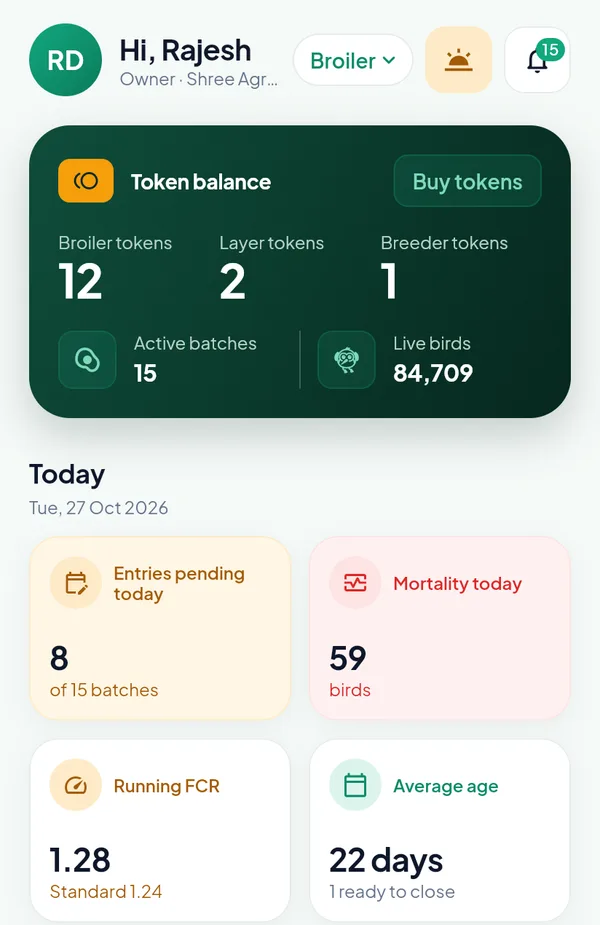
84,709 live birds in 15 batches, 8 entries pending and a running FCR of 1.28 against 1.24.
Entries pending today opens the batch list on the batches without an entry, so the owner can call the right supervisor before the cut-off. Below the tiles, Mortality, last 7 days adds up all open batches: 83, 110, 92, 98, 118 and 117 birds, and today’s 59 in green. A week that climbs from the low 80s to nearly 120 a day is the first hint that something is happening on one of the farms. The Manager sees the same home with the same tiles.
The bell: alerts that need action
The bell counts the unread alerts, here 15, and opens the list of what needs action.
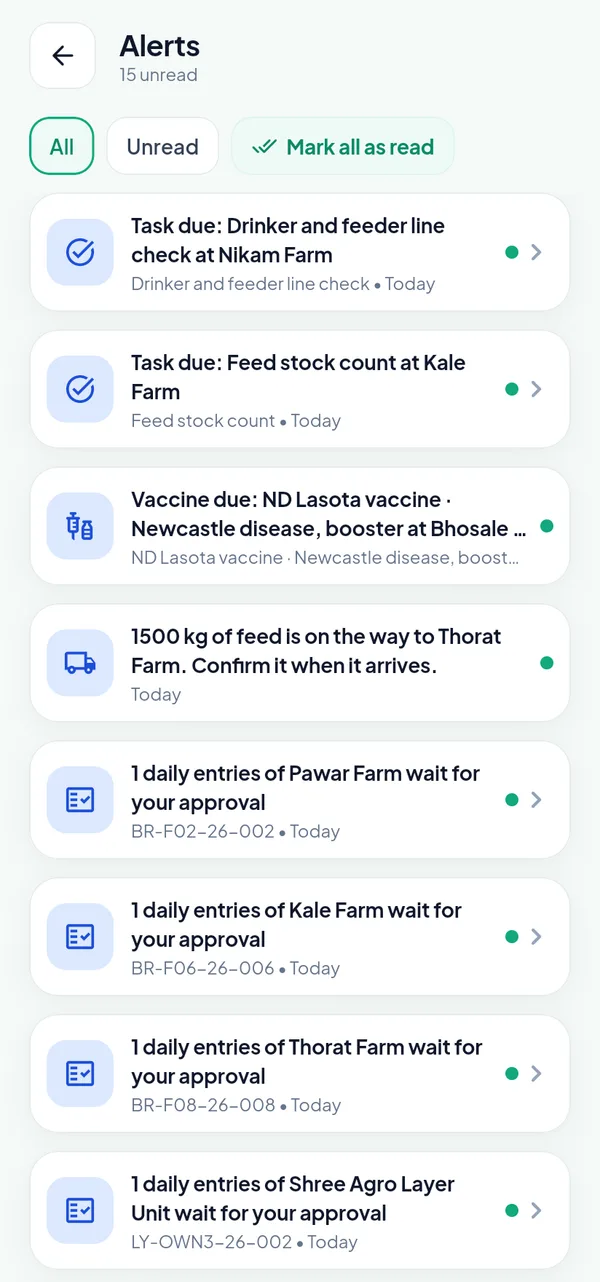
Fifteen unread alerts: two tasks, one vaccination, one feed delivery to confirm, four entries waiting for approval and, at the bottom, high mortality at Thorat Farm.
Besides these, the bell carries weight below standard, low feed stock, few tokens left, a tag by a colleague and an answered ticket. A tap opens the batch, task or delivery behind the alert.
Each alert goes to the people who can act on it. High mortality reaches the people assigned to the batch, the Manager, the Vet and the Owner; weight below standard the assigned people, the Manager and the Vet; a low token balance the Owner only. The Owner sets the thresholds in the Settings of the portal. The high mortality alert appears the moment an entry crosses the threshold, not at the end of the week.
First-week mortality, read on the batch
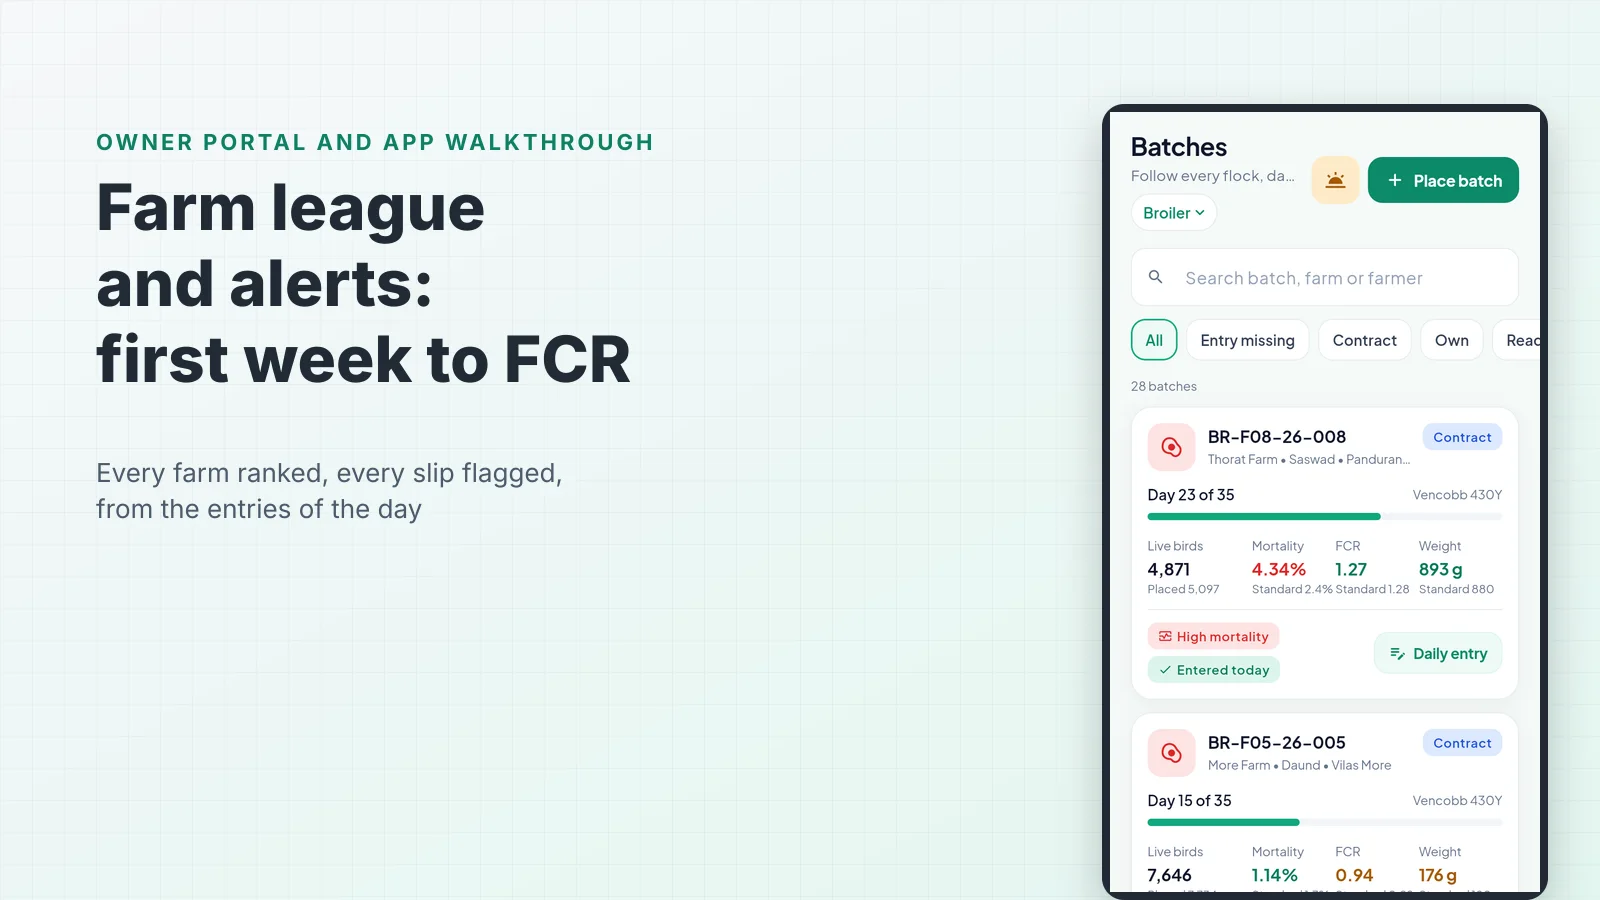
The alert at the bottom of that list belongs to batch BR-F08-26-008 at Thorat Farm. On the batch list of the app, the card carries a red High mortality flag next to Entered today.
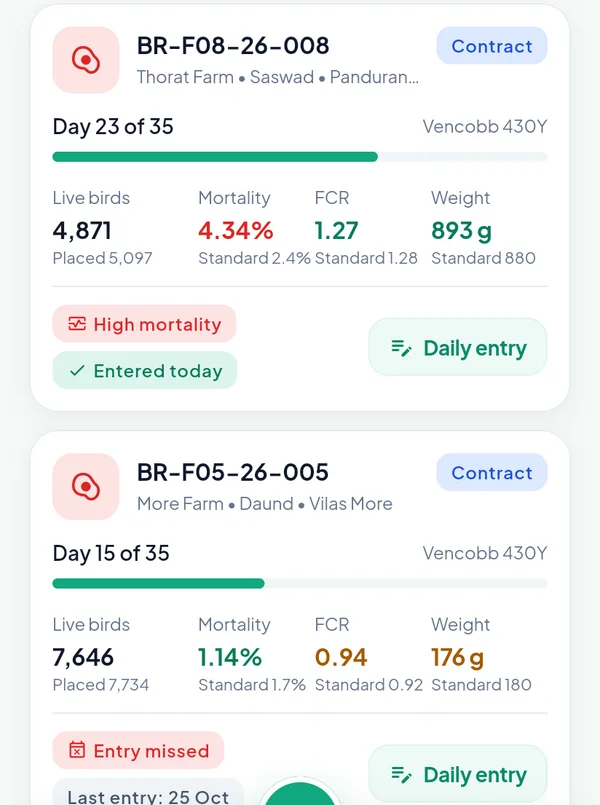
Two farms, two problems: losses at Thorat Farm, no entry since 25 October at More Farm.
Thorat’s FCR of 1.27 is a shade better than the standard of 1.28, and its 893 g beat the 880 g of the chart, so the birds that are alive are growing well. The problem is the dead ones. More Farm has the opposite card: mortality of 1.14 % sits under its standard of 1.7 %, but the FCR of 0.94 and the 176 g are just off the standard of 0.92 and 180 g, and the red Entry missed flag says the last figures are two days old.
The Daily mortality chart of the Thorat batch shows when the losses came: the first twenty days stay low and fairly even, and days 21 to 23 stand out as the tallest bars of the batch.
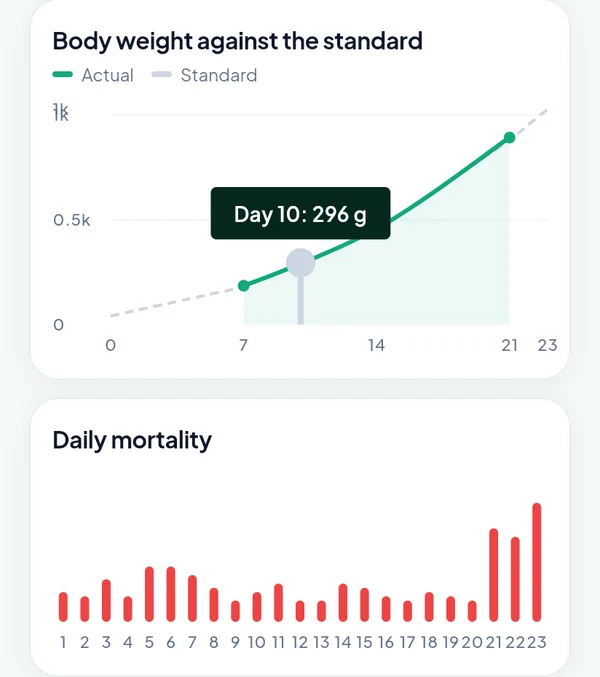
The weight line runs on the standard; the daily mortality bars jump on days 21 to 23.
The batch page of the portal splits the same figure in two. The Mortality tile shows 4.34 % against 2.4 % on the left and, on the right, First week 66 and To date 221. Out of 5,097 birds placed, 66 died in days 1 to 7, about 1.3 %; the other 155 died after the first week. A first week that went wrong points at the chicks, the brooding and the water lines, as our post on what first-week mortality tells you explains. A late rise in a batch that grows on standard points at the shed today: heat, ventilation, the litter or a disease that just arrived.
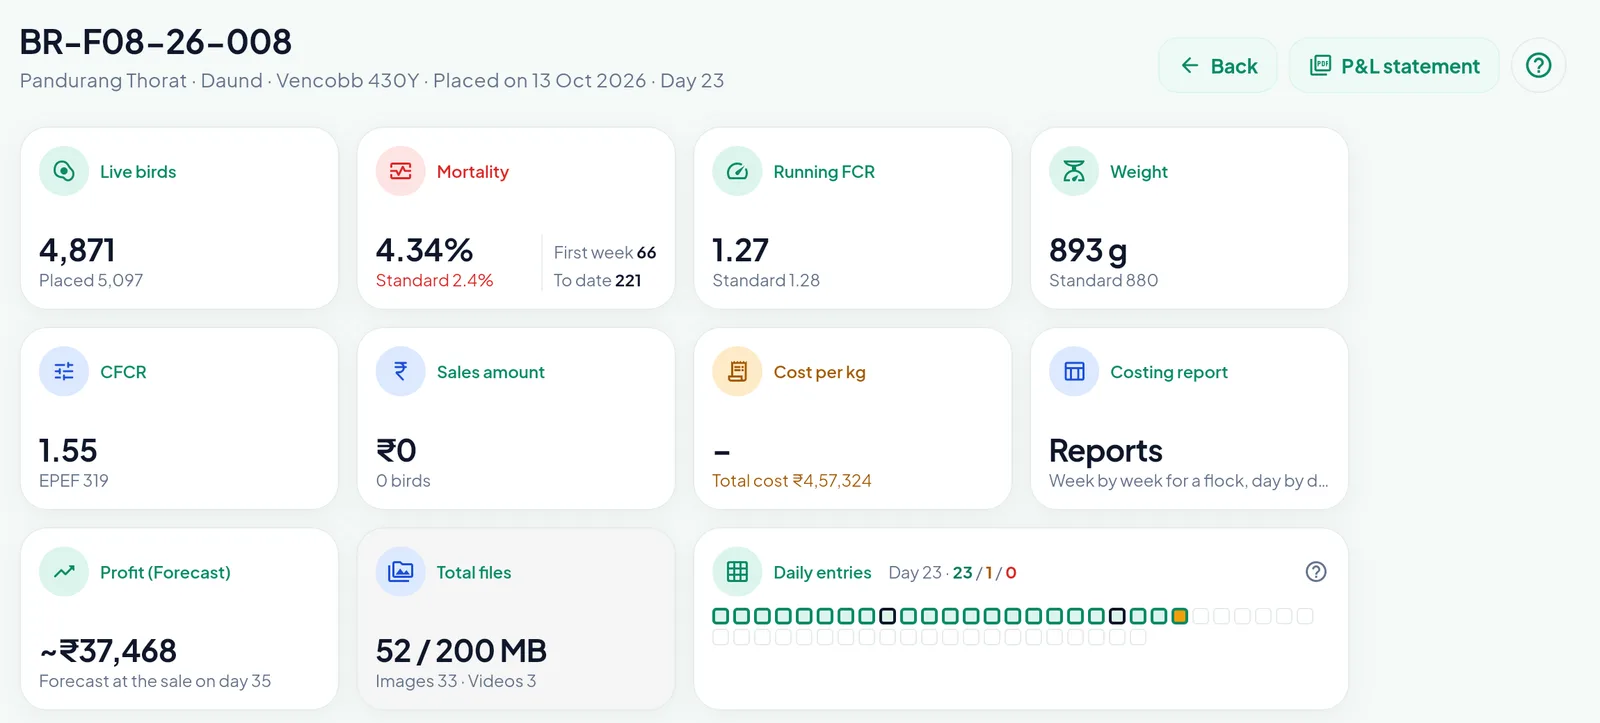
First week 66, to date 221: most of the losses came after day 7. Daily entries: 23 entered, 1 waiting, none missed.
The card Daily entries beside it shows whether the farm enters every day: green for entered and approved, orange for waiting, red for missed. Thorat has no red box.
FCR in poultry: drift against the standard, every day
FCR, the feed conversion ratio, is the kg of feed a flock has eaten for every kg of live weight it has made; the lower, the better. FCR rarely jumps. It drifts, and by the time the closing FCR is known the feed is eaten. PoultryOS raises no separate alert for FCR; the running FCR stands next to the standard of the same day wherever a batch appears, and the batch page draws both lines.
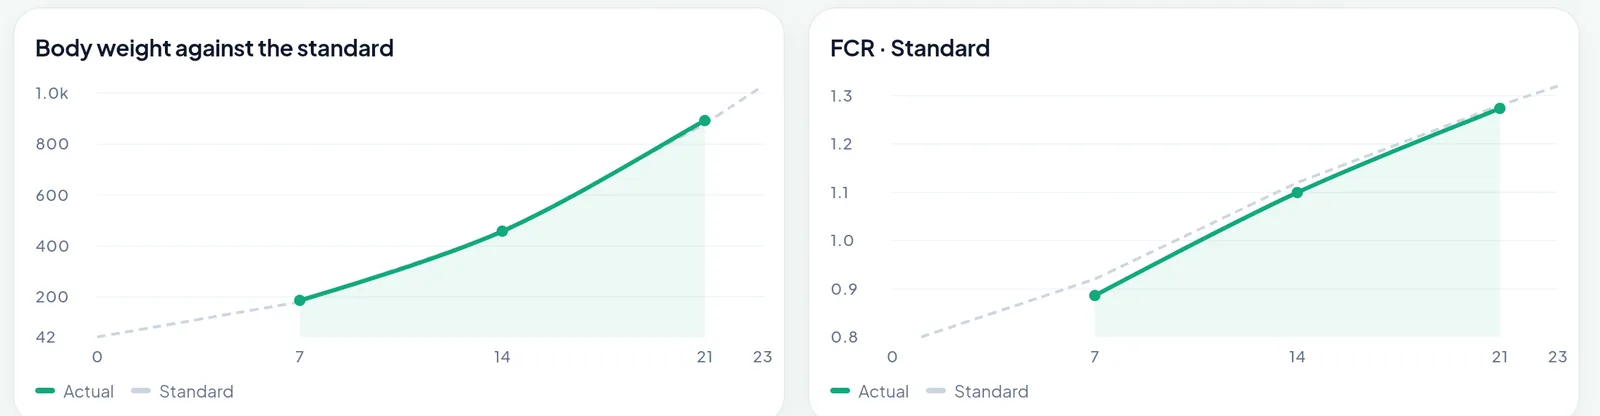
At Thorat Farm the actual FCR runs on the standard line to day 21, so feed is not the problem of this batch.
The running FCR takes the live weight from the latest weighing: the kg sold plus the live birds times the latest sample weight. A batch that is not weighed cannot drift on paper, which is why the sample organisation’s task templates give every batch a weekly weighing from day 7.
The poultry farm dashboard at the office
The Dashboard of the Owner portal shows the same day on a large screen, and adds what an office plans with: the placements of the month and the batches reaching their target age in 7 and 14 days, the lifting plan of the next fortnight.
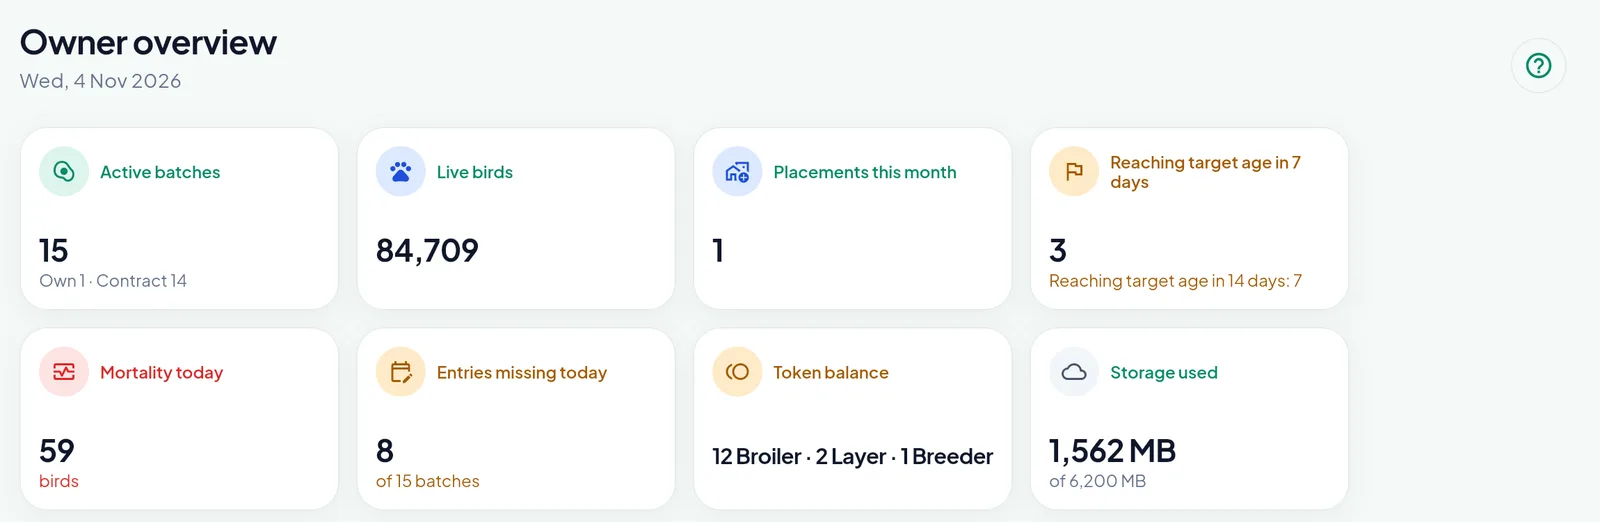
Three batches reach their target age within a week and seven within two; 8 of the 15 batches still have no entry today.
Mortality today opens the mortality register of the day and Entries missing today the batches without an entry. Under the tiles, the 30-day mortality trend adds up every open batch, or only the ones picked in the Batch box, and the card beside it lists the FCR and EPEF of the closed batches.
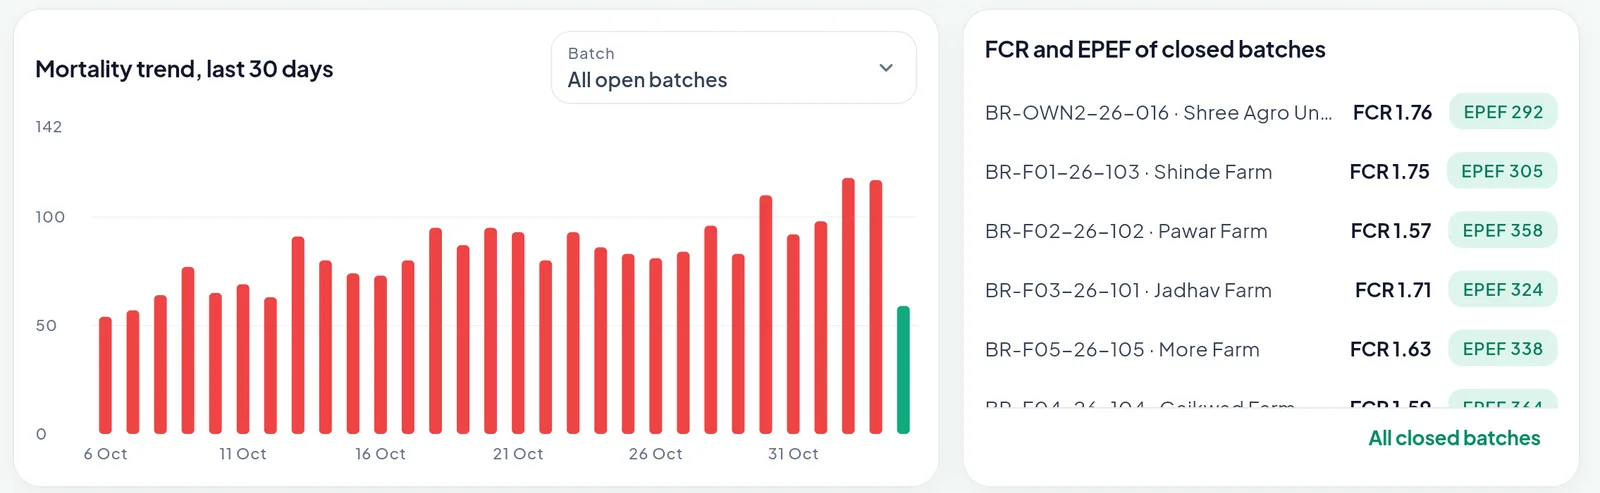
Thirty days of mortality, and the closed batches from EPEF 292 to 358.
At the foot of the page, Recent alerts can be filtered by kind. The Batches page shows every open batch as the same card as the app, with filters by farmer, batch number, placement date, status and type.
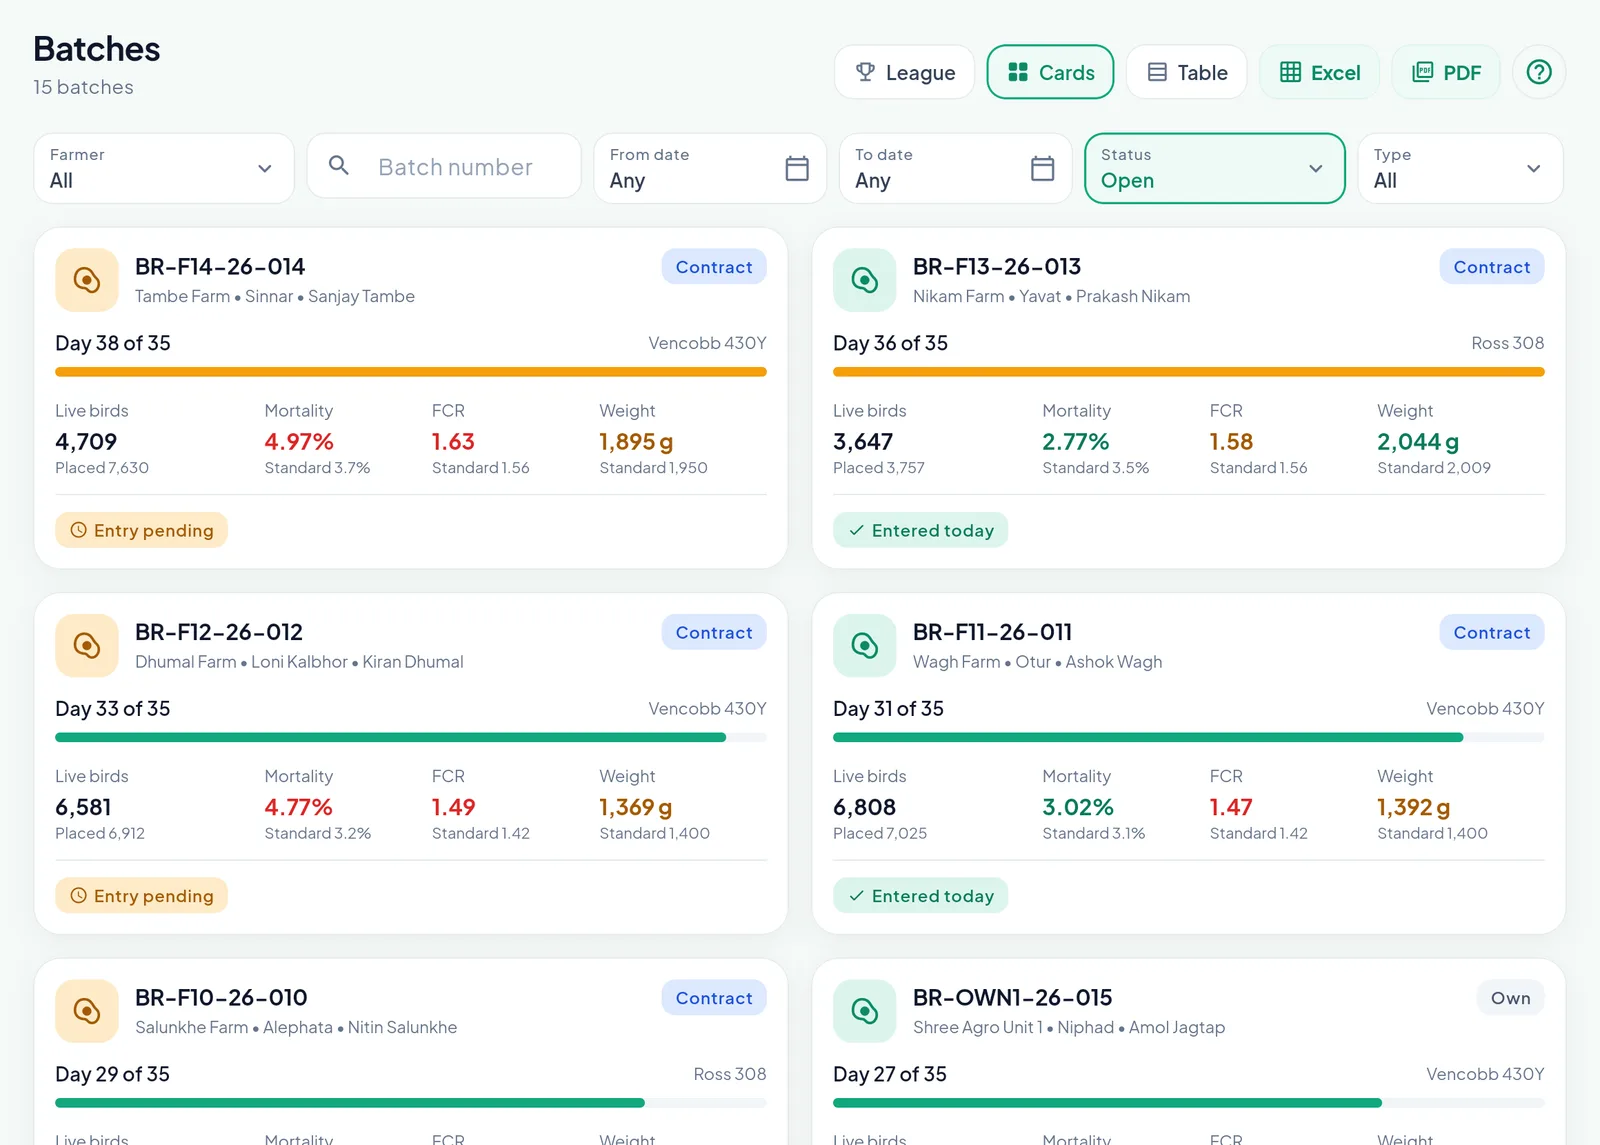
Tambe Farm, three days past its target age, runs an FCR of 1.63 against 1.56.
Drift shows here. BR-F12-26-012 at Dhumal Farm is on day 33 with an FCR of 1.49 against 1.42, and Tambe Farm is at 1.63 against 1.56. Neither number looks alarming on any single day; next to the standard, both farms are a call for the branch manager.
The farm league: farm performance ranking, batch by batch
The League button on the Batches page ranks the same batches by result. The chips Sort by pick the order: EPEF, FCR, mortality, cost per kg or cost per bird. Status All puts the open batches beside the closed ones; a batch enters the league after its first weighing.
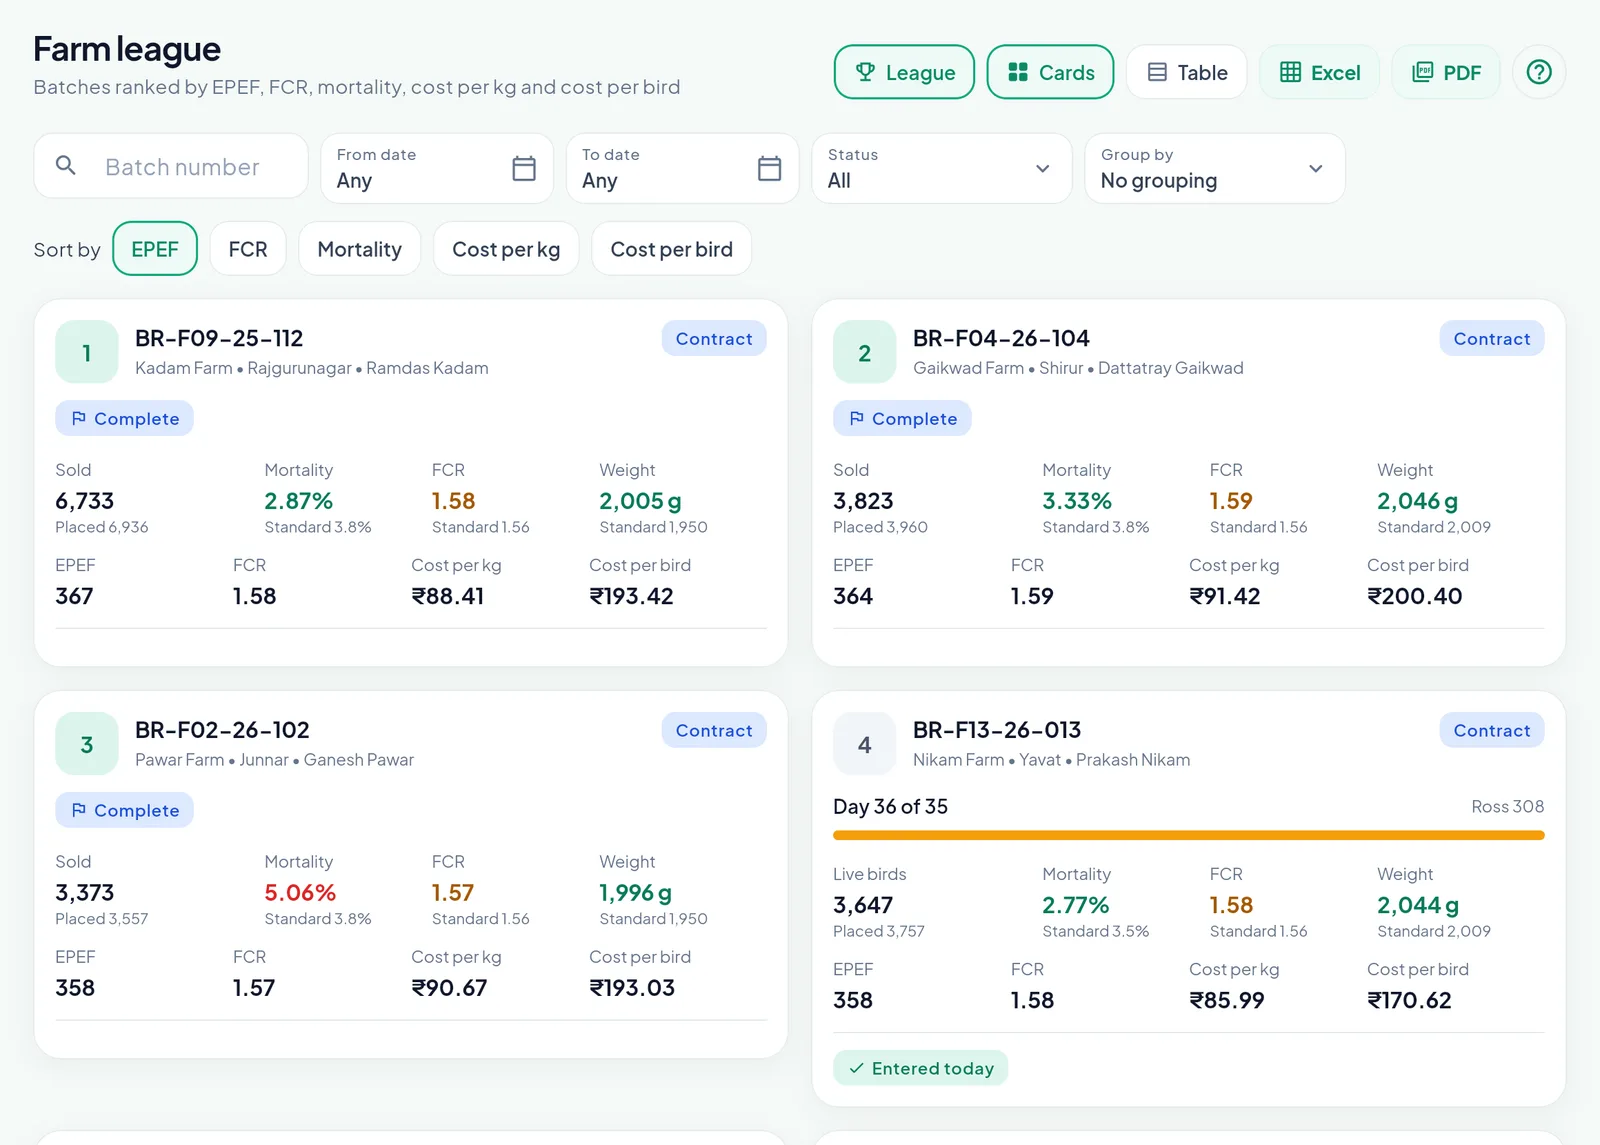
By EPEF, Kadam Farm leads with 367. Pawar Farm is third with 358 despite a mortality of 5.06 % against 3.8 %.
The order matters. By EPEF, Kadam Farm (367) leads Gaikwad Farm (364), Pawar Farm (358) and Nikam Farm (358). Pawar Farm reached third with a mortality of 5.06 % against a standard of 3.8 %, because its FCR of 1.57 and its 1,996 g kept the index up. Sort by Mortality and Pawar drops behind the others on this screen. Sort by Cost per kg and Nikam Farm, at ₹85.99, comes first of the four, ahead of Kadam’s ₹88.41. One index never tells the whole story.
Group by ranks farmers, branches, clusters or regions instead of batches. Each group gets one line, and its figures come from the totals of its batches, not from an average of their ratios: the FCR of a group is all its feed divided by all its weight, its mortality all its dead birds divided by all its placed birds. A click on a group opens its batches.
Excel and PDF export exactly what the filters show, so the league becomes the agenda of the monthly farmer meeting. Layer flocks have their own league, ranked by hen-day production, eggs per hen housed, feed per egg, mortality and cost per egg.
Why one entry should feed every view
The home screen, the bell, the batch page, the dashboard and the league answer one question: which farm needs me today? They agree because they read the same daily entries through the same formulas: EPEF from liveability, weight, age and FCR; FCR from feed and live weight; mortality against the birds placed. To see FCR and EPEF against the standard for a register you already keep, upload it to the free batch dashboard.
For an integrator that changes the rhythm of the week. The mortality alert reaches the supervisor and the Vet while the shed can still be fixed, the drift on FCR shows on the card while there is still feed to save, and at the end of the month the league ranks every farm on the same rules. A register records the farms; a poultry ERP ranks them.
Frequently asked questions
When does a batch enter the farm league? After its first weighing. Until then there is no weight, so there is no FCR or EPEF to rank it by. With Status set to All, open batches are ranked beside the closed ones; with Closed, only finished batches are compared.
How is the FCR of a farmer or a branch worked out in the league? From the totals of its batches, not from the average of their ratios. The FCR of a group is all its feed divided by all its weight, its mortality all its dead birds divided by all its placed birds, and its EPEF the mean of its batches weighted by the birds placed, so a small batch does not count as much as a large one.
Who receives a high mortality alert? The people assigned to the batch, the Manager, the Vet and the Owner. The alert appears as soon as an entry crosses the mortality threshold the Owner sets in the Settings of the portal, as a percentage of the opening birds of the day.
Is there an alert when FCR drifts above the standard? Not an alert of its own. The running FCR stands against the standard on every batch card, on the batch page and on the home screen, and the league sorts by it. The alerts that catch a slow batch early are weight below standard and high mortality, both with thresholds in the Settings.
Can a Vet see the league and the dashboard? A Vet sees only the batches assigned to them and no money figures, so cost per kg, cost per bird and the profit stay hidden. The Owner and the Manager see every batch of the organisation.
How is FCR calculated in poultry? Feed eaten divided by the live weight produced. PoultryOS adds up the feed of every daily entry and takes the live weight as the kg sold plus the live birds times the latest sample weight, so an open batch has a running FCR every day, next to the standard of its breed for the same day.
Rank your own farms
A league is only as good as the entries under it, so the best test is your own farms. Book a demo and we will set up a sandbox organisation with your farms and your breed’s chart, so you can see your branches ranked in poultry management software that your supervisors already fill from the phone. The Contract Broiler Farming (CBF) Software module page shows the whole batch cycle, and the earlier posts cover the daily entry on the phone that feeds every figure here and approvals, compliance and the edit window that keep those figures honest.